Trading journal
See the complete truth behind every trade.
Transform your trading history into clear insights with a P&L calendar, risk analytics, and per-symbol performance breakdowns.
Built for the platforms you already use.






- Tradovate
- TradingView
- NinjaTrader
Why most traders plateau
Your balance tells you the score — not the story.
Profit shows the outcome, but the real insights come from understanding your performance, risk, and trading behavior.
You don't really know why you win or lose
The real edge is in when you win, how you risk, and what you keep repeating — and none of that is in your account balance.
Risk and drawdowns hide in the noise
A good month can mask brutal drawdowns and oversized lots. If you can't see your risk, you can't manage it.
You can't see your best and worst conditions
Which pairs actually pay you? Which stretches drain the account? Without the breakdown, you're guessing.
Meet your journal
Every closed trade, turned into a clear picture.
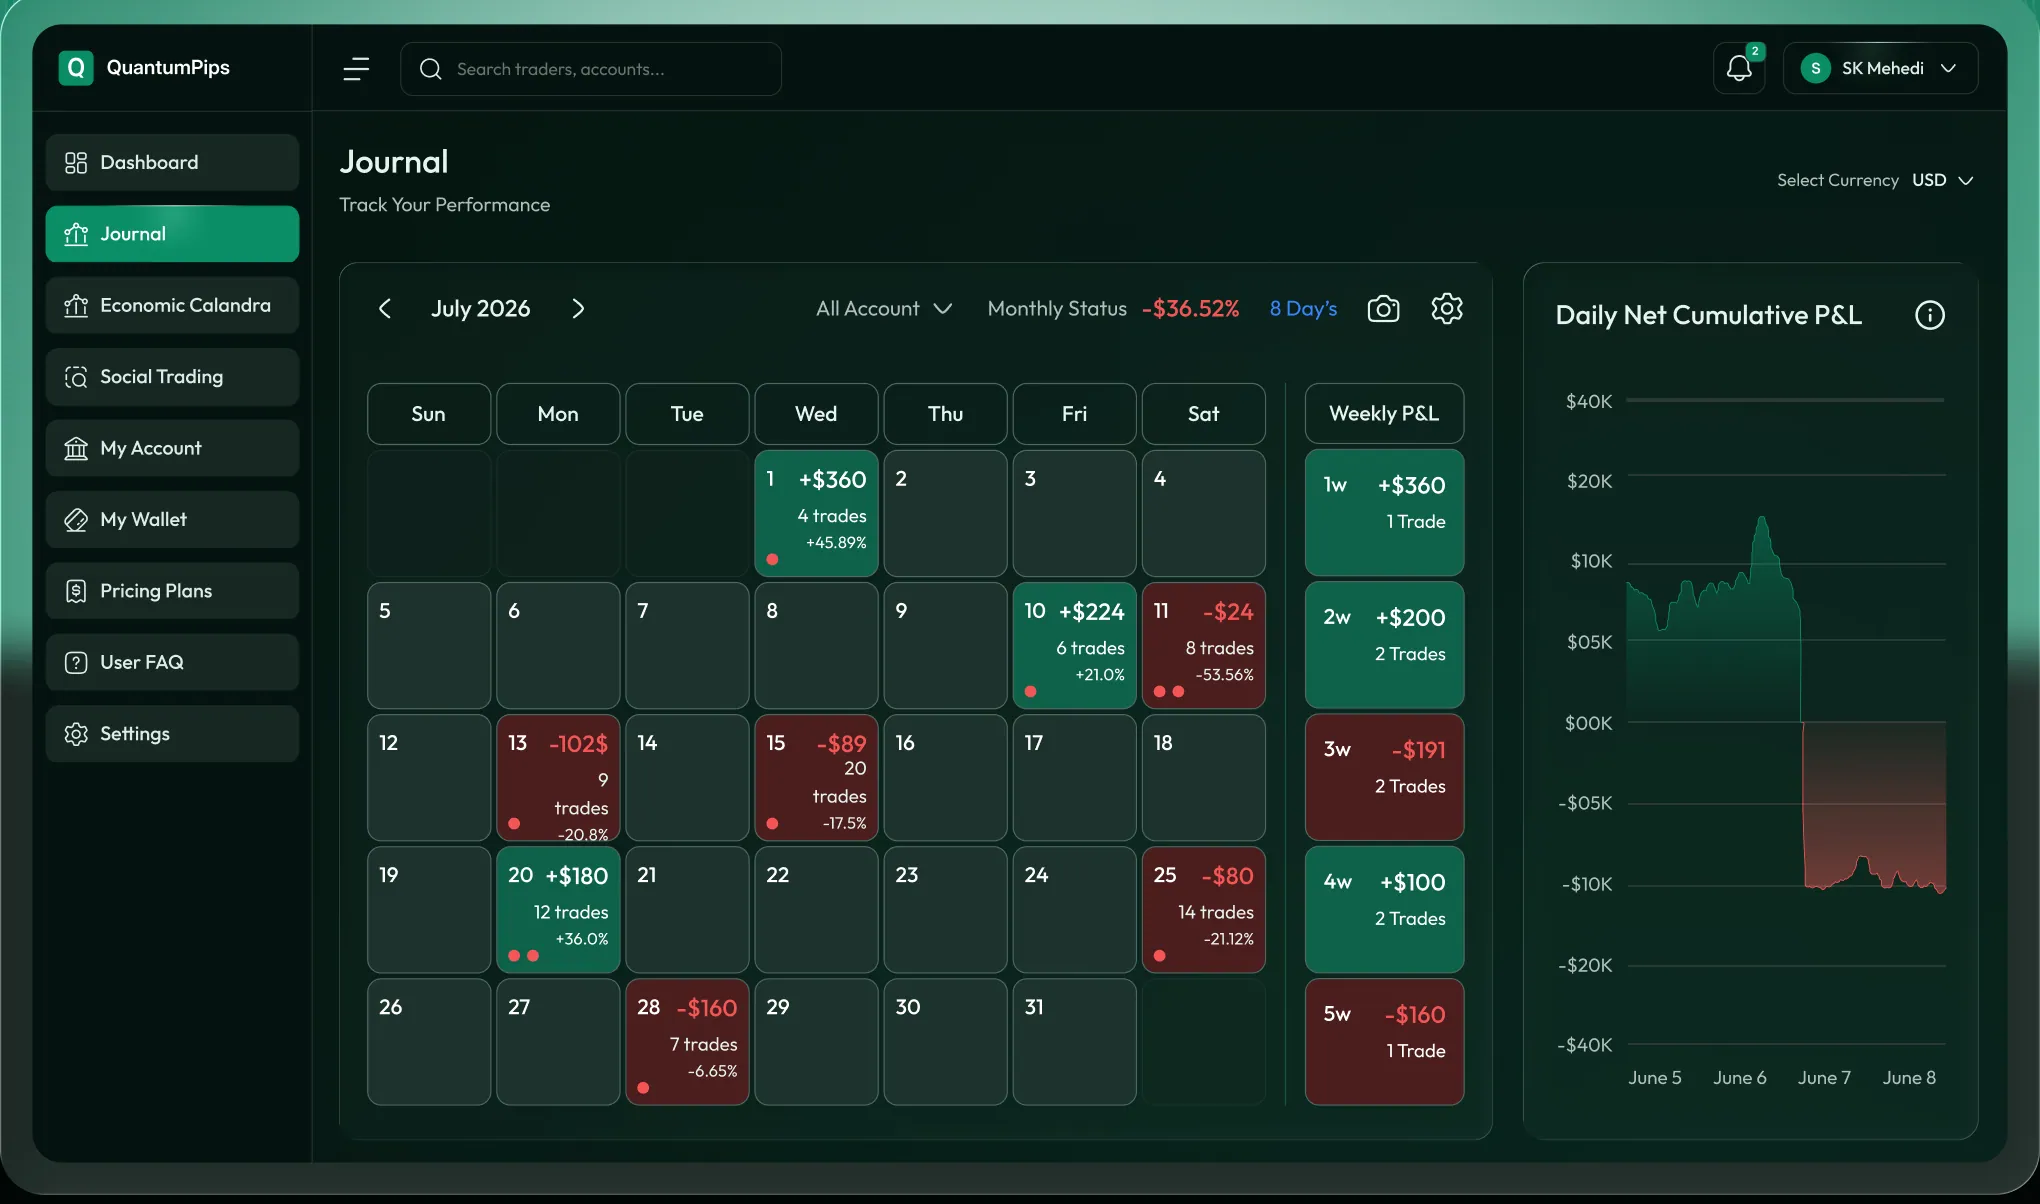
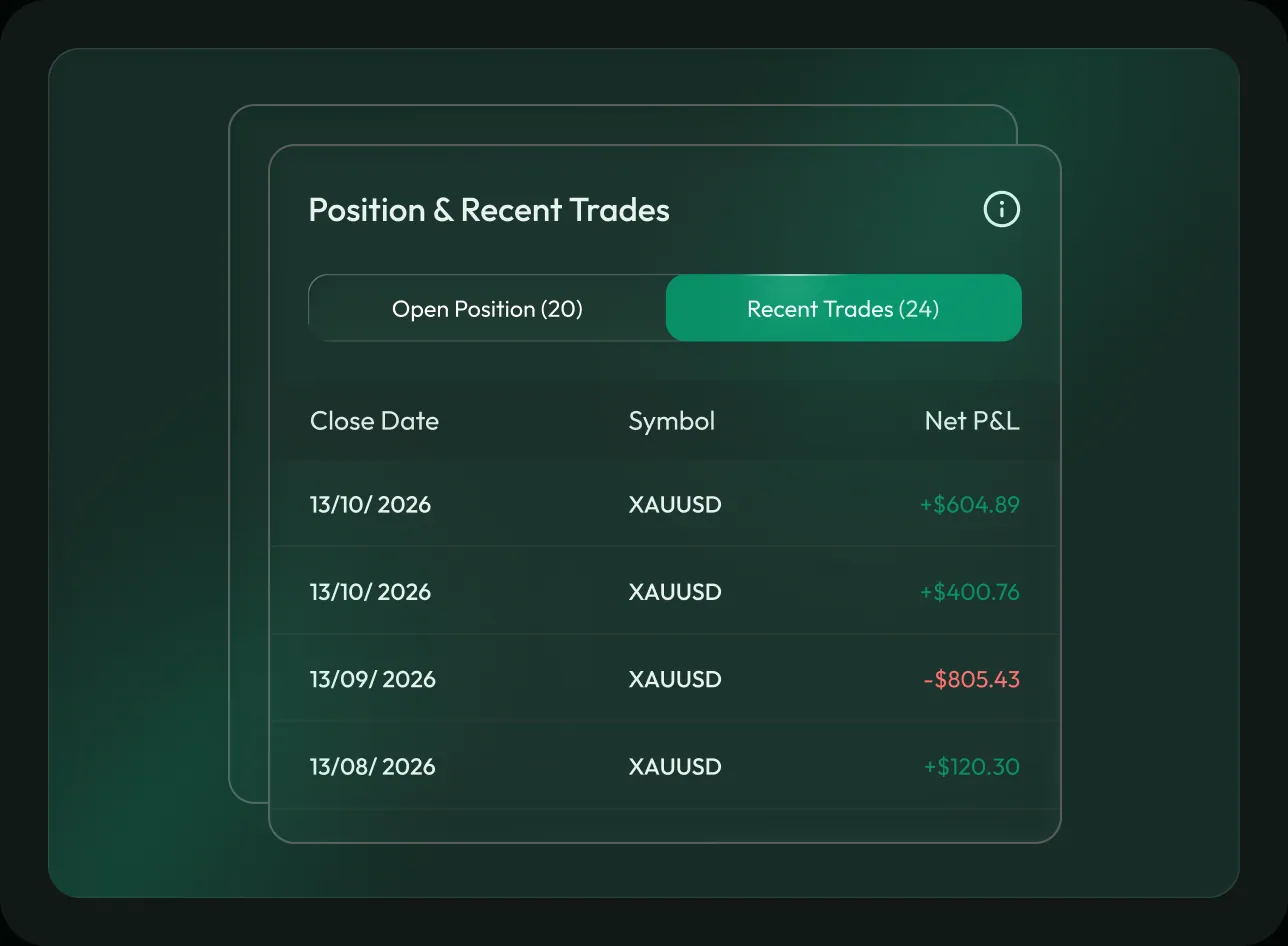
A month-at-a-glance P&L calendar, your equity curve, your risk profile, and a per-symbol scorecard — all built automatically from your real trading history, across every account you connect.
What you get today
Performance analytics, from your real trades.
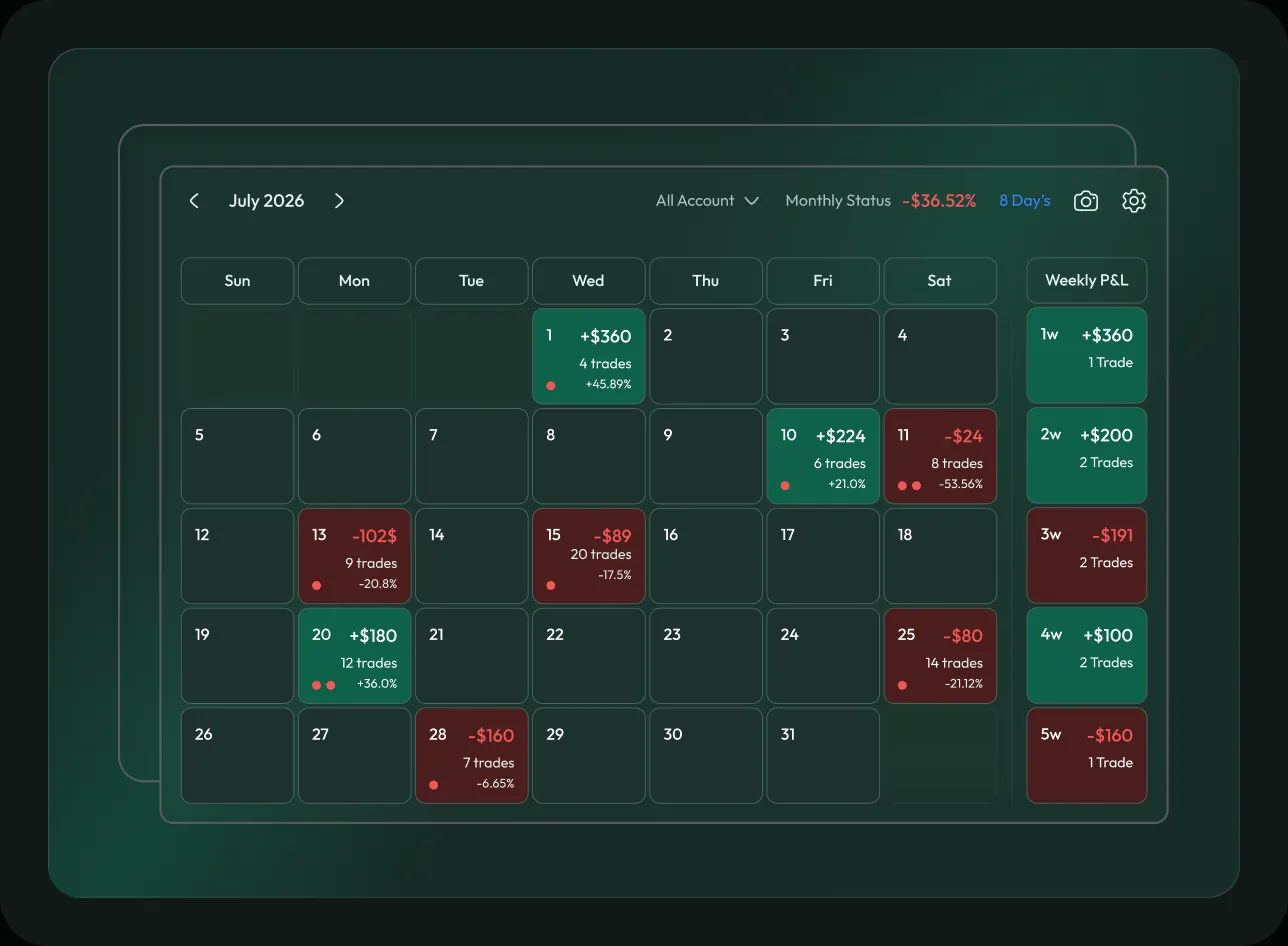
A color-coded P&L calendar showing realized profit, win rate, and trade count for every trading day. Filter accounts, browse months, and export as an image.
Your month, at a glance.
A P&L calendar that color-codes every trading day with your realized profit, win rate, and trade count, plus monthly totals. Filter by account, flip through months, and export it as an image.
- Every day color-coded by realized P&L
- Win rate, trade count, and monthly totals
- Filter by account, flip months, export as an image
On the roadmap
More on the way.
- Coming Soon
Per-trade journaling
Notes, tags, screenshots, and ratings on every trade.
- Coming Soon
Time-of-day heatmap
See exactly which hours and sessions you trade best.
- Coming Soon
Advanced metrics
Measure performance in R-multiple, pips, ticks, or points.
Platform Capabilities
- Real broker data
- 7 time windows
- Sharpe / Sortino / drawdown
- Export to PNG
- All accounts
- Per-symbol P&L
Economic-event overlay
See the high-impact news that moved your trades, right on the calendar.
FAQ
Copy trading questions, answered.
Still have question?
Can't find what you're looking for? Our team is just a message away.
Contact SupportA P&L calendar, a cumulative P&L curve, risk analytics (Sharpe, Sortino, max drawdown), and a per-symbol performance breakdown — all from your closed trades.
Your own real trading history, pulled from your connected accounts — nothing is manually entered, and it isn't mock data.
No. Your closed trades flow into the journal automatically from the accounts you connect.
Per-trade journaling — notes, tags, screenshots, and ratings — is coming soon. Today the journal focuses on your performance analytics.
Yes — view a single account or all accounts together, across seven time windows from one day to all-time.
Sharpe and Sortino need a couple of weeks of trading history to be meaningful, so they appear once you have enough data. Max drawdown shows right away.
Start Today
Stop guessing. Start trading with complete confidence.
Your trades already hold the answers — QuantumPips turns them into your greatest trading edge.